

Virginia Bio-Informatics Institute Visualization Simulations
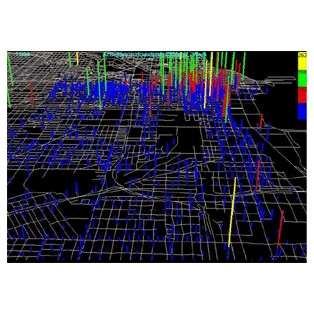
The intention of this project was to create a time series visualization of simulation results for bioterrorism events in large urban areas. The Virginia Bioinformatics Institute (VBI) created data regarding what activities took place in a city during the course of a day, how many people were in a building at a given time of day, and what activities these people were involved in.
The Center for Geospatial Information Technology (CGIT) received this information and created a moving picture model that provides the geographic frame of reference for daily activities of transportation systems, waterways, and other resources. These representations allow for a large amount of information to be comprehended at a glance. This method of graphical representation was created by CGIT and involves converting VBI data into usable formats and scripting that data to make it three-dimensional.
See our Previous Projects
